Appearance
Dashboard Overview
Use Insights to monitor payment activity for the selected entity. The dashboard shows key metrics and charts that help you understand payment performance, transaction volume, customer activity, and merchant performance.
The selected entity defines which data is shown. For example, if you select a client, the dashboard can include data across the entities below it. If you select a channel, the dashboard focuses on that channel.
The data shown on Home and Insights depends on the currently selected entity. For example, a client-level view shows aggregated data across the entities below it, while a merchant-level view focuses on the payment activity of that merchant.
Home and Insights
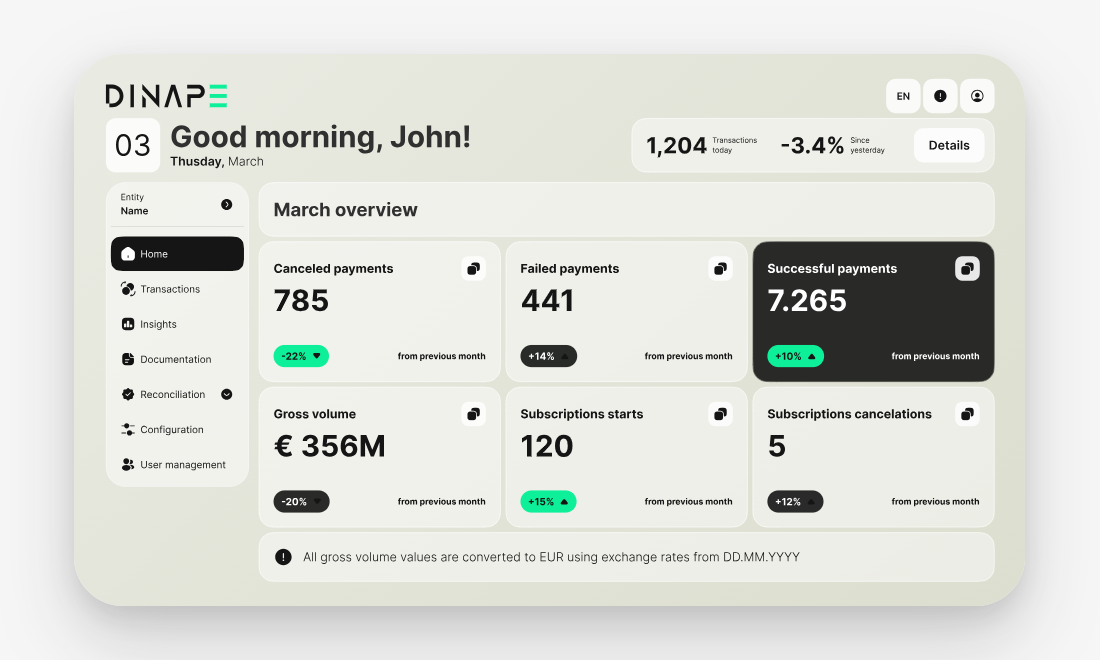
Dinape shows high-level KPIs on Home and detailed reporting widgets in Insights.
Use Home for a quick overview of the current month, including successful payments, failed payments, canceled payments, gross volume, subscription starts, and subscription cancellations.
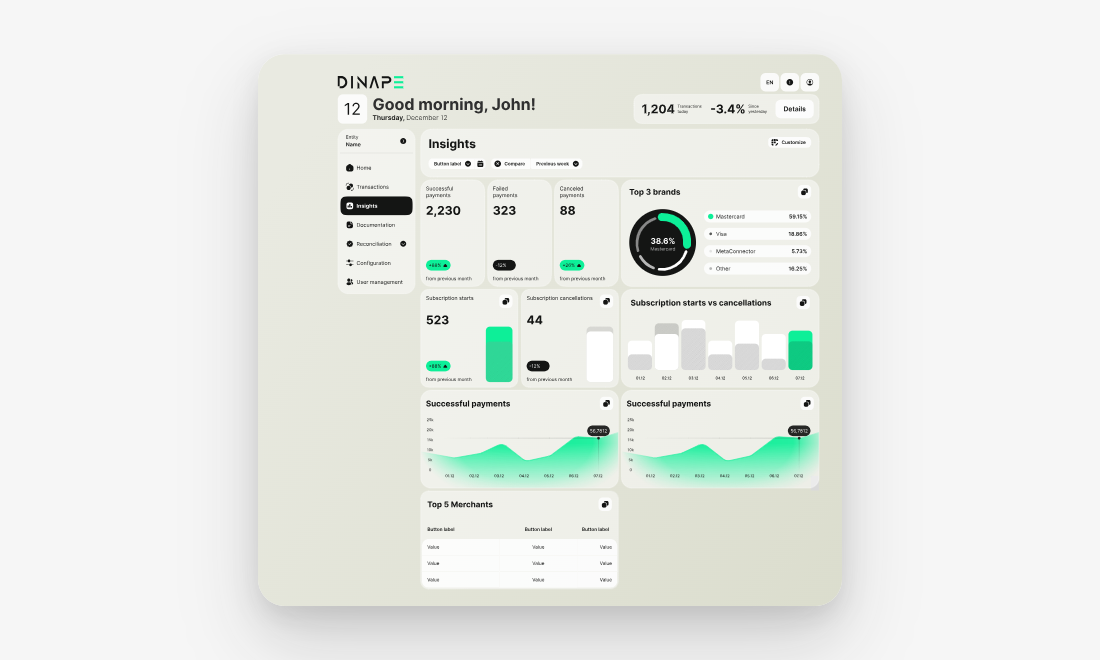
Use Insights when you need more detailed dashboard views, reporting periods, charts, merchant rankings, payment brands, or a customizable layout.
Select the reporting period
Use the date range and interval filters to change the dashboard view.
You can select a reporting period, such as the last 12 months, and choose the interval used for the charts, such as monthly.
The available dashboard data depends on the selected entity, time period, and your access rights.
Review payment performance
Use payment performance widgets to review the number of successful, failed, and canceled payments.
Each widget shows the value for the selected period and the comparison with the previous period where available.
Review payment methods and brands
Use the brand widgets to understand which payment brands are used most often.
For example, Top 3 brands shows the most used payment brands for the selected entity and period.
Review transaction volume
Use transaction volume widgets to understand how payment activity changes over time.
For example, Count of transactions shows transaction count across the selected period, and Gross Volume Histogram shows payment volume development.
Review merchant performance
Use merchant widgets to compare payment activity across merchants.
For example, Top 5 Merchants shows merchants by quantity and amount for the selected period.
Review subscription activity
Use subscription widgets to monitor subscription-related activity, such as subscription starts and subscription cancellations.
Customize the dashboard
You can customize the dashboard by adding, removing, and rearranging widget groups.